Mystery of the Date String,
This is based on a true story of one of my debugging adventures. Diagrams, code samples and names have been changed for privacy reasons.

Morning Routine
It was a cold winter morning. The kind where you wonder if the tickle in your throat would justify taking a sick day off. The last time this happened, my wife questioned why I would even think of doing so. In her stern yet "non-accusatory" tone of voice, she reminded me that my co-workers won't have to worry about my germs since I code remotely from home.
Fair enough. I slowly stepped downstairs to my office to start my work day. Still in my pajamas.
I started working as a front-end developer in November 2021 and was grateful for the opportunity. Actually, more than thankful; it was a lifesaver. During that time workplaces were forcing their employees to follow certain mandates. and I wasn't willing to follow the herd. All my life I've followed the narrow road. My non-compliance made my parents angry. My dad said he would have fired me if he were the boss. I also received a very long email from my wife. I deleted it when I saw the word 'divorce' in there somewhere. At the depth of my despair, I wrestled with God and He gave me a blessing in disguise. I was able to pivot careers from working in libraries to coding. With a higher salary, better flexibility and a happier wife I was able to use my previous community college education in computer programming to start a new career.
Bug Ticket
My work day started with a new notification. It was a bug ticket assigned to me. The title read, "User sees 'Data Unavailable' error". In the description, there was a link to our customer support chat with the client. It went something like this:
Client: I'm not able to see my projects. See screenshot.
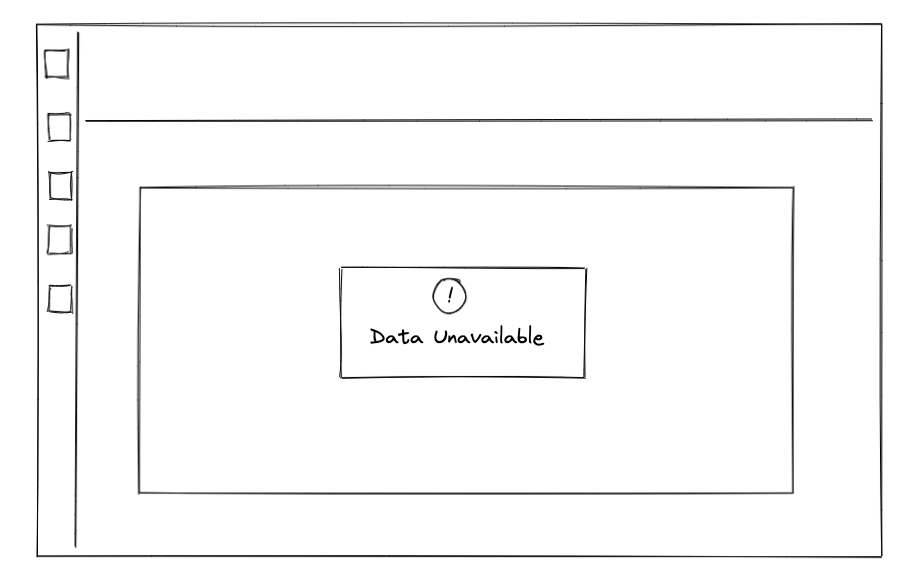
I was also provided an admin link that allowed me backend access to the client's site. I clicked the link and saw the error. Yup, I was able to recreate the error. I mentally prepared myself to play detective. I remembered a famous quote:
"when you have eliminated the impossible, whatever remains, however improbable, must be the truth."
Momentarily distracted by the misplacement of my Star Trek pin, I refocused.
I needed uninterrupted deep-thinking time.
I placed the hood of my hoodie over my head.
Round 1
Hmmm, the usual table of data isn't being displayed. When I click all 3 various views to see the data, they all say 'Data Unavailable'.
Why? Are we getting the data at all? How can I check?
I opened the browser's dev tools to the Network tab. I refreshed and filtered by Fetch/XHR requests. The results were interesting.

Turns out the only failures were related to Sentry (an error monitoring tool) and LaunchDarkly (a feature flag tool).
Now you may be thinking, why don't I simply use Sentry to find out what the error is? My reply would be because that cuts to the chase and wouldn't make a good story. (I'm trying to win a blog contest here folks. Plus, I didn't know how to use it, until the end of my work day when my manager showed me how to. But by then it was too late. Sentry told me what I already discovered).
I logged into the unfamiliar terrain of LaunchDarkly and searched for our client's name. It popped up with a list of flag variations for this particular client. I speculated that since this client is a registered user in LaunchDarkly, perhaps this means they're a special targeted user. Combined with the fact that she was "last seen 6 hours ago" suggests that maybe there was a feature flag that was recently turned on or off just for this particular client and if we switch it back, maybe the data will appear again.
I asked my manager for advice.
My manager said that the users listed in LaunchDarkly aren't there for the reasons I thought it was. So I continued to pass Go without collecting $200.
In my local development, I created an account using the same email as our client. However, when I logged in using those credentials, there was no issue as I was able to view the project data in all three views. This is where I pinged my co-worker Will to help out. Will is such a friendly backend engineer to work with, kind of harkens back to the good ol' days of Mr. Rogers in the Neighborhood. I always ask Will for help when things aren't working (I'm looking at you Docker startup issues). Yes I know our company has a Slack channel for #engineering-help, but honestly I don't feel like I'm worthy to ask questions in there yet. That's okay, usually one of the senior people (thanks Alex) asks the same question we're all thinking then we all benefit from the answers.
Will starts messaging me in Slack about the bug, "I'll do some digging in the database to see if anything obvious comes up." I reply with my usual 👍 emoji. After a few minutes, Will verified that the client has the appropriate permissions and roles in the web app. I asked Will about the console errors I found earlier. "hmm those might be a red herring. I'll check the user settings and see if anything sticks out."
Will did determine that the error was only specific to this client user. Other similar user accounts were not affected.
Will then asked the following question that became key to my debugging adventure:
"In the front-end code is there anything that would cause it to show 'Data Unavailable'? I believe that text comes from frontend so I'm curious how it would be triggered?"
"Okay I'll take a look," I said.
In VS Code, I did a global search for the phrase 'Data Unavailable' and lo and behold, there it was on line 177. It was in the default of a switch case.
getError = () => {
    switch (this.props.errorCode) {
        case Constants.ERR1:
            return 'some error msg';
        case Constants.ERR2:
            return 'other error msg';
        ...
        default:
            return 'Data Unavailable';
    }
}
"Ah ok so the 'data unavailable' is the catch-all," replied Bill.
"Yes"
Using the browser's debugger tools, I was able to use breakpoints to see the value of this.props.errorCode. It was 0:

And when I looked up our list of Constants to see what zero referred to; it referred to an unknown error.
export const Constants = {

    UNKNOWN: 0,
    ...
}
I began to investigate the source of this.props.errorCode. Minutes later, Will found a clue, "can you look in the front-end code to see where the request to the API is made with the following payload?" as he copy and pastes some JSON in our Slack chat. He further explains, "this is the request that returns the projects you see on the screen. But for some reason, when the client is logged in, it does not make this request. Yet, for other similar user accounts it does."
With the 'Data Unavailable' error message staring at me, I right-click it > Inspect > React Components tab. Climbing up the component tree I find the parent component that populates this.props.errorCode. It came from response.errorCode. So now I have to find where response is defined. Ctrl + f to locally search the word response.
Aha. Oh. My. There are several potential places where it can be defined. Hmm. interesting, one of those places is within the getData() function which is probably where that API endpoint should be called but isn't. I place breakpoints on all the places where response is defined. For example:
getData = () => {
    if (this.state.response ...) {

        ...

        this.setState({   /* I insert a breakpoint here */
            response,
        })
    }
}
I run the debugger and anticipate that one of the breakpoints will halt the code.
But it never halts.
Again, the 'Data Unavailable' message persists to stare at me like my cat does when it wants wet food.
Why doesresponse never get defined?
Will replies, "Ping me if I can help at all. But it looks like the frontend is not calling that endpoint. But that might also be because the backend is returning something that makes the frontend not call it. You never know."
Round 2
After quickly eating leftovers, I hustle back downstairs past the under-the-desk treadmill which sadly hasn't been used as frequently as I would like.
I start by placing one breakpoint on the first line inside getData(). I refresh the browser. As expected, it halts on that breakpoint. Now how do these step buttons work again?
Yes I know you can step in, out, or over the code, but from my almost 1.5 years of dev experience, it seems to me they're all the same. Kind of frustrating when they all seem to just open deeper, non-bug related files until you find yourself looking at some webpack file. If only there was a way to go from one breakpoint to another breakpo..... [lightbulb💡 moment]
I experiment by running the debugger; it halts at the initial breakpoint. But what happens if I then place another breakpoint below that, remove the first breakpoint, then run the debugger again.....
Let's call my newest way of debugging
"step transport"
Turns out that for this getData() function, it crashes inside a try block:
try {
    /* It crashes at the below line */
    query = this.props.configuration.getQuery(p1, p2, p3);
    ...

} catch (e) {
    ...
}
So now I have to find out why that line is failing.
Could it be one of its parameters is off?
Assuming getQuery is properly defined, what's in it?
I want a side-by-side comparison. So on the left side of my wide-screen monitor is an instance of the app that works locally. On the right side, is the client's site. I compare the parameter values of getQuery using the debugger for both browsers. Turns out that all three parameters match my working local dev environment.
So the bug is not because of the parameters.
Wishing to now view the function getQuery() I click the Cmd button while clicking getQuery() which opens a new file where that function is defined.
Actually, I didn't know about that VS Code trick until another co-worker shared his screen with me for a code review. (Thanks Bob)
Using breakpoints again I was able to narrow down where in getQuery() it crashed. 100 lines deep inside the function was the following code:
getQuery(p1, p2, p3) {

    ...
    /* I inserted a breakpoint at the line below */
    const dateRange = DateFilter(
                parameters.date_string,
                dateCreated,
                today ?? moment.tz(tz),
                params.inc_today,
                ...

            );

    ...

}
At the above breakpoint, I noticed an oddity in the props. The value for date_string seemed far too old:

Hmm, I wonder
Within the debugger, I double-clicked the prop value for
date_stringI manually deleted the date range of "Feb 1 2018 - Feb 20 2018"
I manually typed in our usual default value of "Last 30 days"
I continued the debugger so it ran where it left off and voila:
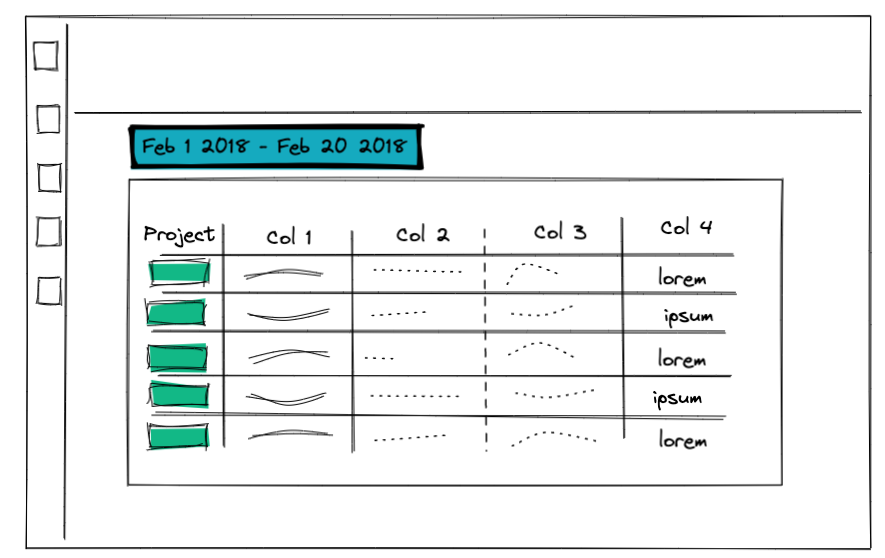
The data loaded, it worked!
Confident that I found the reason it was crashing, I asked Will if he could go into the database and manually change this user's date_string filter to "Last 30 days". However, Will only had read-only access. After suggesting another co-worker who had write access, Will asked:
"What database table was that in? I'm curious how it got changed."
Determined to find out, I changed the date range on my local app to match the client's date string. I then opened every single database table and looked at all the fields to see if I could find that particular date string. After a few minutes, I finally found it, "I think I found the field of "date_string" locally." I then shared to Will a screenshot of its location -- table and field name. Will then used a tool called Grafana to access the database in production. Indeed, he found the date string value for the client was 'Feb 1 2018 - Feb 20 2018'.
Will then wondered:
"Do you know anything about that setting? I wonder why it's that value? I wonder if the user can set it back on their own to "Last 30 days?"
"I think you're right, if the user was able to set that back themselves, it would work, but the problem is the date picker won't display because it's encapsulated inside the component which itself errors out."
Then Will asked something that piqued my curiosity, "Are you able to reproduce the error on the front end locally? I can change my date range in the UI to match the client and my env still works."
I said I hadn't, but that I would dive inside DateFilter function to see what's happening in there.
Round 3
I knew I was so very close to why it crashed the way it did. Initially, I thought I found the answer since I was able to manually change a prop to a different date string causing the client's data to load. Thus, the solution would be to change the erroneous date range in the database. But Will's question made me curious as to why I couldn't reproduce the error locally. I went back to find where ReportFilter was being defined. It opened up a new file with a 200-line function. It had a switch statement within a switch statement whose purpose was to parse date ranges.
I discovered that it crashed on the line:start_date: DateHelpers.format(DateHelpers.parse(start)),
export default function ReportDate(date_string, p2, p3, p4) {
    ...

    default: {

        ...

        return {
            /* crashes at below line */
            start_date: DateHelpers.format(DateHelpers.parse(start)),
            end_date: DateHelpers.format(DateHelpers.parse(end)),
        };
    }
}
Curious, I wanted to see what would happen if I replaced the
startvariable with the string "Feb 1 2018"After all, it should be no different
So, I made the change, then loaded the app locally...

Would you look at that? My local, once-working app crashed and displays the same error message as the client! I was able to reproduce the error locally.
So what was different about the start date when I chose it via the date picker?
Undoing what I just did, I chose the same date range using the date picker. Doing so revealed one slight difference in the start date -- the start variable had the value of "Feb 1, 2018"
a comma, there was a comma!
I then went back to manually replace start and end variables with commas, "Feb 1, 2018" and "Feb 20, 2018" respectively and it worked! I soon discovered that DateHelpers.parse() can't handle the no-commas.
I found the bug.
I updated everyone involved in the bug ticket. My manager complimented my discovery and suggested two things to try before asking a backend person to change the date_string database entry. The first suggestion was to go into the client's app, and as before manually change the prop to make the data display, then change the date range to "Last 30 days". However, when I tried that it crashed as soon as I clicked the date range.
I pinged Bill with the second suggestion, "Yeah I don't know how the no-commas date got in there. But it was recommended that I try using Insomnia to send the date update request manually to the API endpoint. I'll probably ask you for help Monday if I can't figure it out."
Bill replied, "Weird, maybe there was a recent frontend code change where commas were allowed? You bet just ping me Monday."
Round 4
On Monday, I wanted to figure out what endpoint, JSON, and Header data I should use inside Insomnia to fix the bug. With my devtool's network tab open, I selected a date range of "Yesterday". I found the PUT request and examined its URL, Header, JSON. In particular, the JSON had the following data:
[{
   "key": "date", "value": "Yesterday"
},]
So in Insomnia, I created a new PUT request and replicated the JSON and Header values. Theoretically, if I run this call from Insomnia, it should always reset the date range to yesterday.
To test that theory, I replicated the error by going into my local database and changing the date range to have no commas. Upon refresh, I saw the familiar 'Data Unavailable' error. Using Insomnia, I ran my PUT request and I no longer saw the error but the data with the date range of "Yesterday" -- perfect!
Going to the client's site now, I looked at the Network tab and found a similar PUT request and figured all I had to do to make this client's site work in production is change three values: URL, user id in the query param, and header authorization.
I knew how to solve the problem, but I felt nervous about implementing it in production. I asked my manager for help and he guided me as I screen shared and made all the necessary changes. All I had to do was click 'Send'.
My excitement and underlying suspense reminded me of that classic hacker movie scene in Sneakers.
I clicked 'Send'
My heart skipped a beat
I refreshed the client's site....

It worked! I let customer support know that the client's site is now back to normal. However, since we still don't know how the date without the commas got there in the first place, if the client could tell us the steps, we can fix it.


